

One of the corporate freelance clients I worked is the American Society of Addiction Medicine (ASAM).
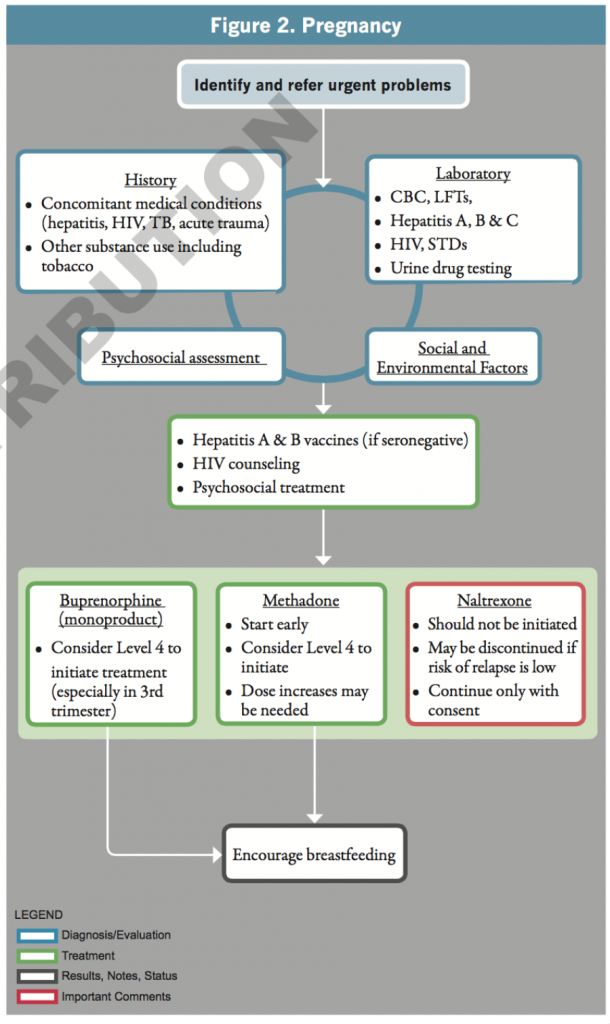
The first project was the improved layout for their infographic for a slide pack and print, and I wanted to explore their other instructional materials. One of the assets in their PDF documentation is a flowchart about pregnancy and addiction. This is intended to inform healthcare providers with the best practices in assessing and treating cases.
I wanted to see if I could work with the static data on the printed page, to make it more dynamic, compelling, and ultimately easier for a viewer to understand. Using their printed chart as a guide (a demo version of this included here), I prepared this video demo for them. I used After Effects to create this motion graphic. I believe the motion graphic not only looks better, with intentional color schemes and layout, and it communicates the data in a clearer way.

Leave a Reply
You must be logged in to post a comment.